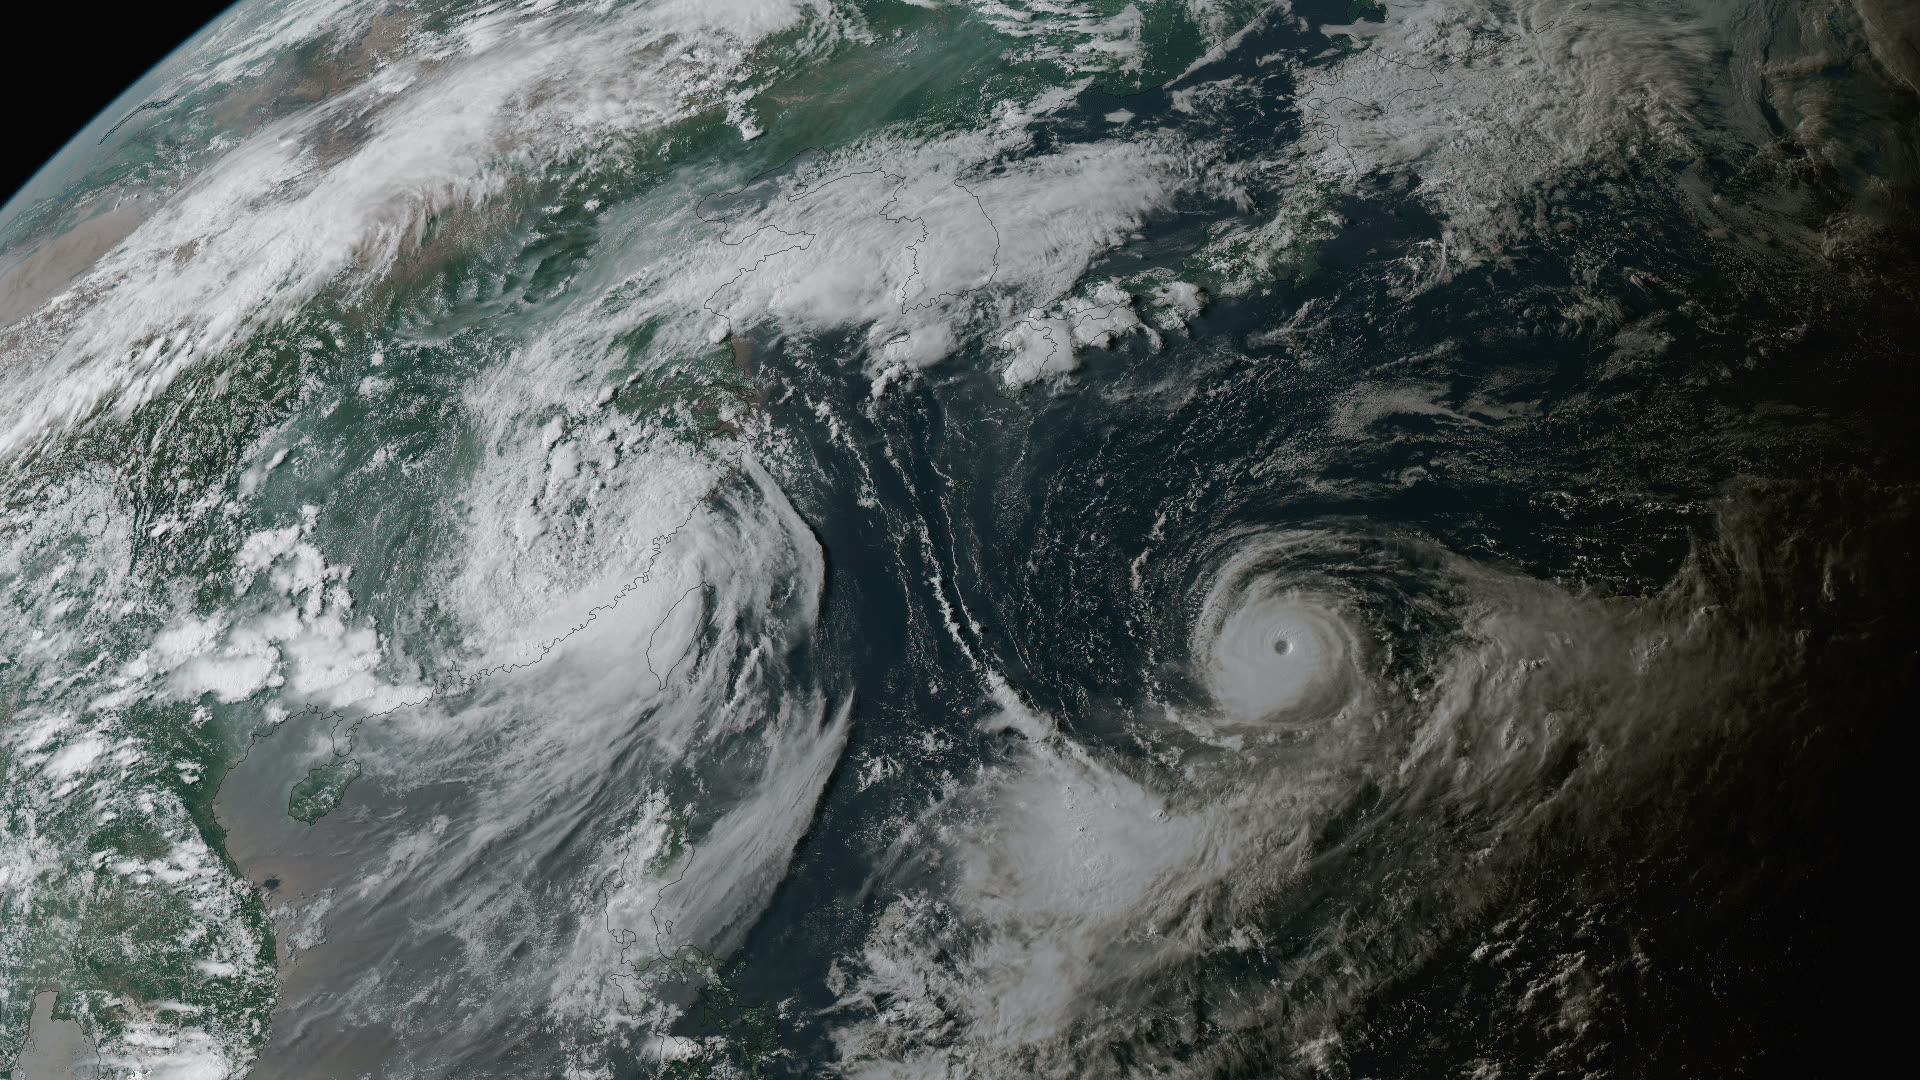
 JMA / Wikimedia Commons · CC BY 4.0 01
 Typhoon tracking
Satellite imagery and ensemble track forecasts follow a typhoon’s genesis, movement and landfall in real time, buying precious hours for disaster response.
Professional, without the complexity
AtmoSeq brings satellite imagery, numerical weather models and live observations together, delivering the underlying physical quantities straight to your screen — with real-time visualization, custom rendering, alerts and timeline replay for enthusiasts, professionals and researchers.
Core Features
01 / Unified
The data was never the problem — getting it all in one place was. Every source, done right and brought together in a single view.
02 / Engine
Getting the data in is only step one. Viewing, computing, tweaking, saving — our in-house StormCore engine handles all of it.
03 / Time
Drag the timeline either way, speed it up or slow it down. Watch a system form and fade, rewind it or pause on any frame.
04 / Layers
Layer order, opacity, visibility — set them however you like. Side by side to compare, or stacked to overlay.
05 / Color
Custom colormaps, ranges and opacity are right at hand. Change one setting and the picture updates instantly — the same sky, recolored, tells a different story.
06 / Custom
The presets are only a starting point. Which variables to show, and how to combine them, is entirely up to you.
Use cases
JMA / Wikimedia Commons · CC BY 4.0 01 Satellite imagery and ensemble track forecasts follow a typhoon’s genesis, movement and landfall in real time, buying precious hours for disaster response.
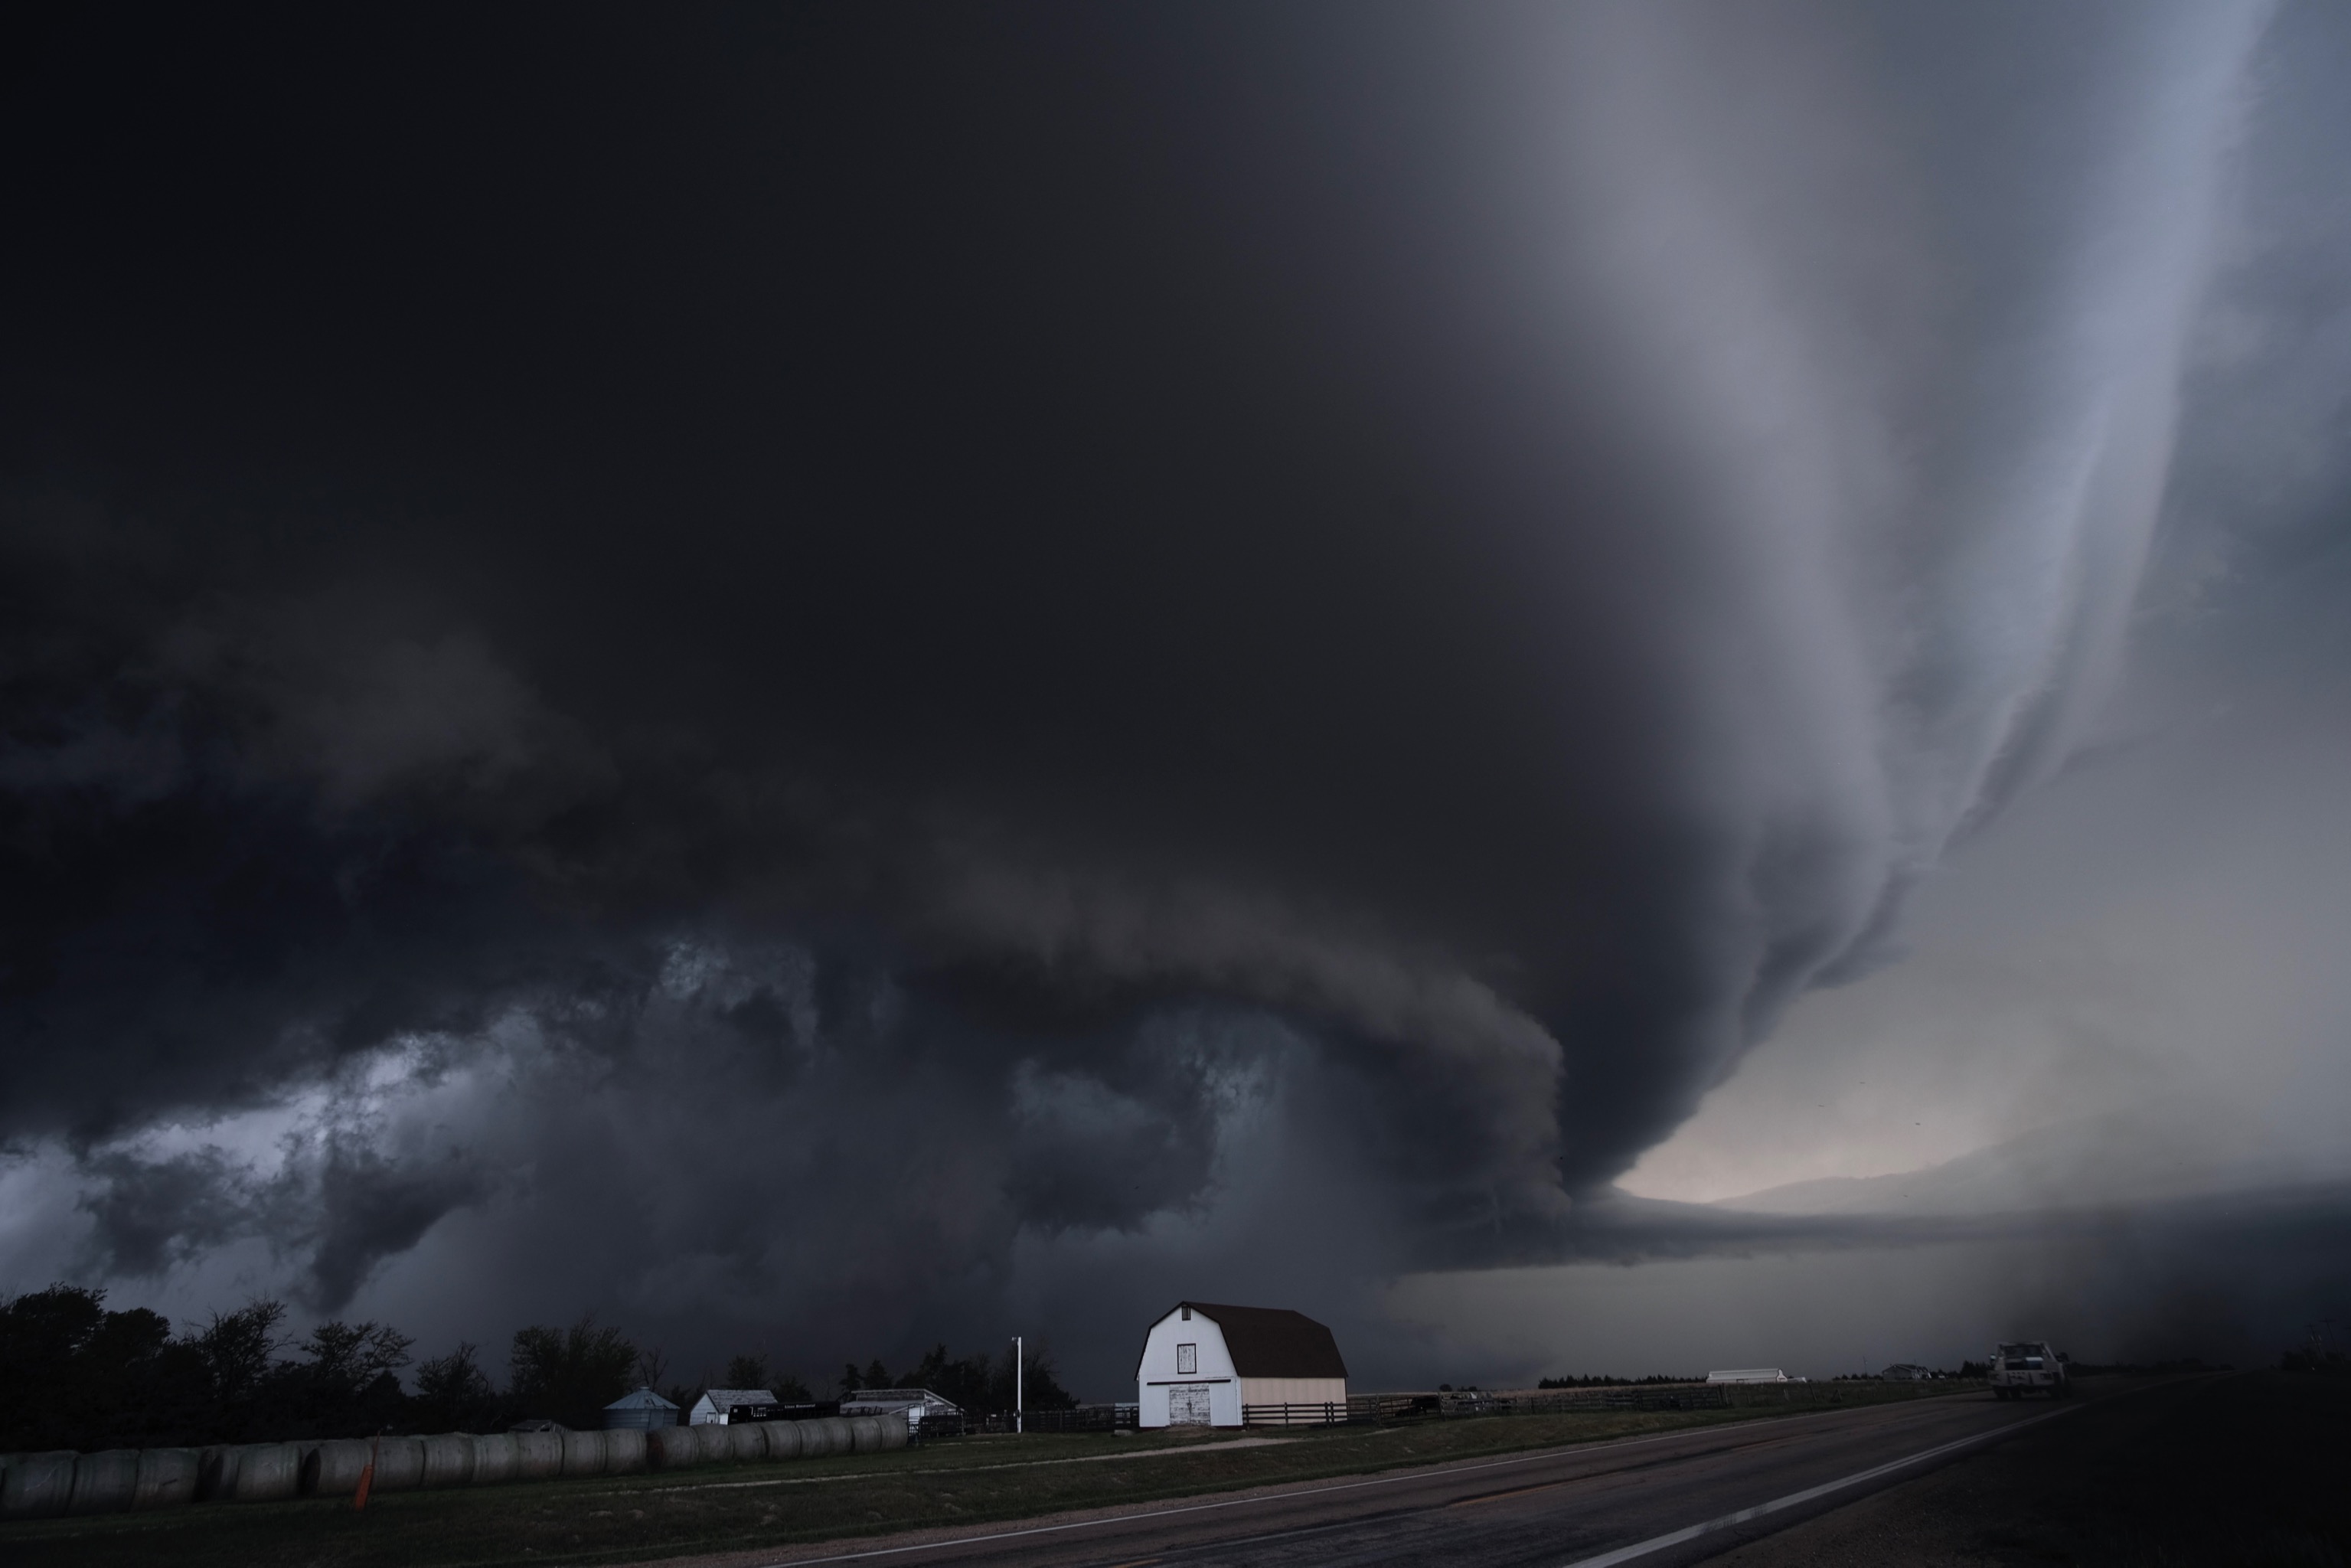 NOAA / Wikimedia Commons 02
 Infrared brightness temperature keeps an unblinking eye on convective clusters, so no sudden cloud-top cooling slips past you.
 Pexels 03
 Sunset glow quality and 4-day probability forecasts — plan every chase and never come home empty-handed.
Pipeline
STEP 01
Across every format and medium, vast streams of raw signals are gathered into one solid, global data foundation.
STEP 02
Dedicated pipelines cut through opaque raw formats to reach the data’s underlying structure.
STEP 03
In a multidimensional space-time frame, every fleeting slice of weather is anchored to a precise location.
STEP 04
Instead of baking rigid images, we turn raw products into live data streams you can take apart any way you like.
STEP 05
We don’t dictate how the data should look — we put the engine’s full power at your fingertips.
STEP 06
Data comes alive: the native engine computes it in real time, bringing the next turn in the weather into clear view.
AtmoSeq is in web beta. Registration requires an invite code; explore the beta options and weather analysis features.